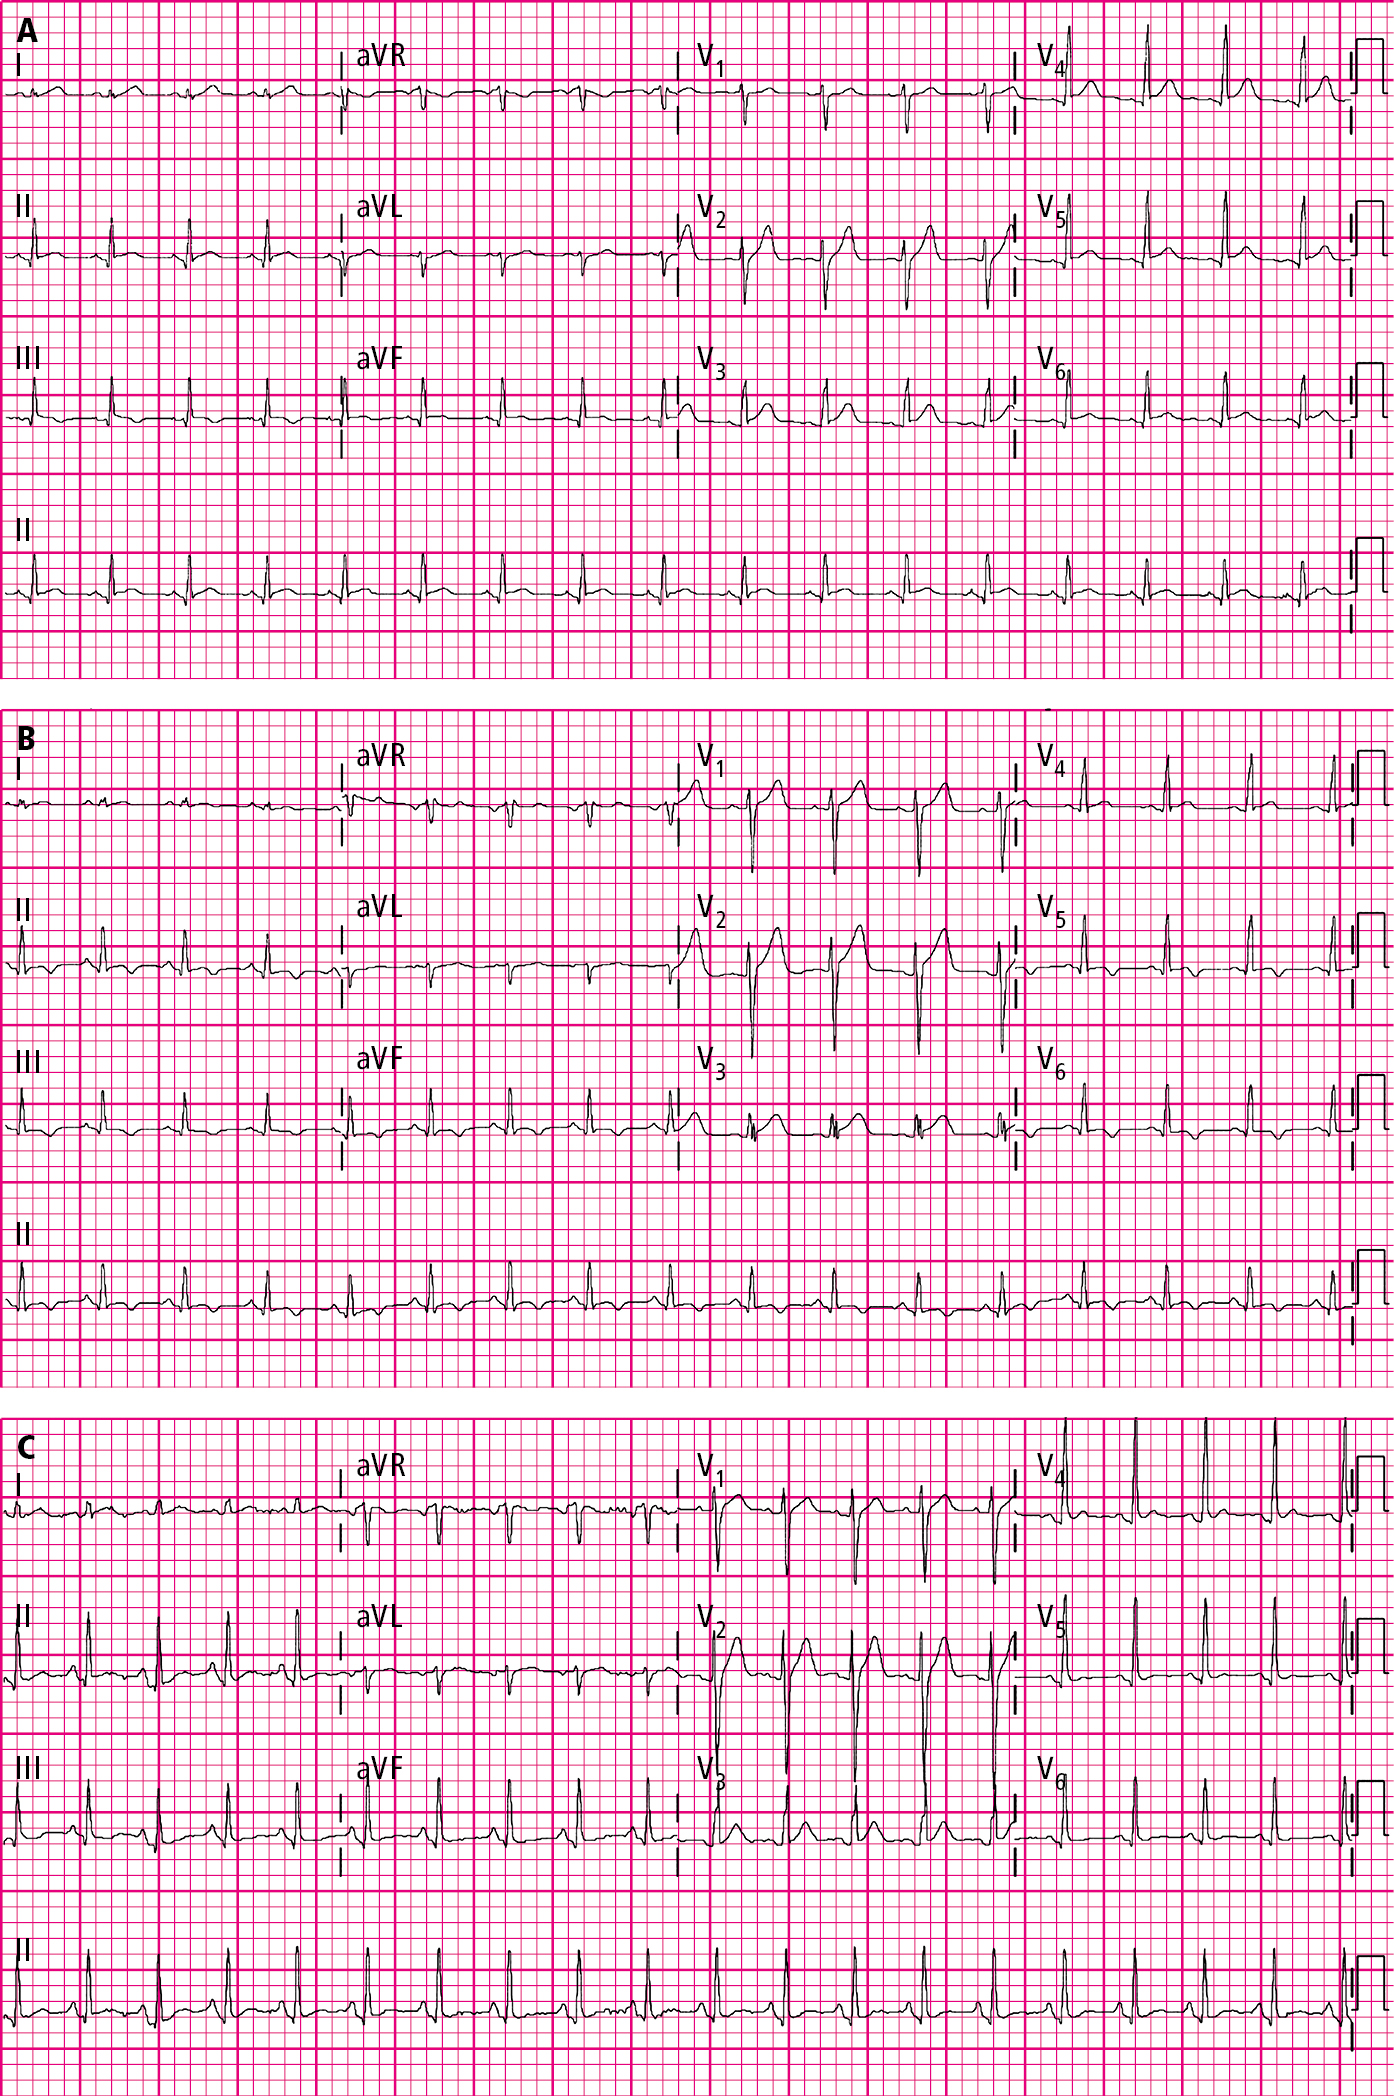
Classic electrocardiography (ECG) evolution in acute pericarditis. The initial ECG shows a diffuse ST-segment elevation and PR depression (A), which is followed by the resolution of the ST-segment elevation and then the presence of diffuse T-wave inversion (B), and lastly by improvement of all ECG changes (C). Figures courtesy of Dr Hassan Mir.