 English
 Español
 українська

Test DescriptionTop
1. A standard electrocardiogram (ECG) is a recording of cardiac electrical potentials using electrodes connected to form 12 leads:
1) Limb leads: The electrodes are placed immediately above the wrists on the dorsal surface of the right arm (red) and the left arm (yellow) and immediately above the ankle on the left leg (green) and the right leg (black; ground potential):
a) Standard (bipolar) limb leads are called I, II, III.
b) Augmented (unipolar) limb leads are called aVL, aVR, and aVF.
2) Precordial (unipolar) leads are called V1 to V6. Electrode location on the chest: Figure 20.2-1. When inferior wall myocardial infarction is diagnosed, leads Vr3 and Vr4 should be recorded routinely to exclude right ventricular infarction (an indirect sign of a coexisting right ventricular infarction is an ST-segment elevation ≥0.5 mm in leads Vr3 and Vr4 at the J point).
2. A normal ECG: Figure 20.2-2.
1) Positive (upward) or negative (downward) deflections are called the P, Q, R, S, T, and U waves. The Q, R, and S waves together form the QRS complex (or the QS complex if the R wave is absent).
2) A horizontal line between the U and P waves, or between the T and P waves if the U wave is absent, is called the isoelectric line (baseline) of the ECG.
3) The line between the P wave and the QRS complex is called the PR segment. The line between the QRS complex and the T wave is called the ST segment.
4) Intervals consist of a wave and the adjacent segment, for instance, the PR interval or the QT interval.
3. ECG is registered on a millimeter grid that records the heart rate as well as durations and amplitudes of individual waveforms (Figure 20.2-3):
1) At the standard paper speed of 25 mm/s, the distance between the two thin lines of the grid (the small box) represents an interval of 0.04 seconds, and the distance between the two thick (darkened) lines (the large box) represents an interval of 0.2 seconds. At the speed of 50 mm/s, they represent intervals of 0.02 seconds and 0.1 seconds, respectively.
2) The standardization (calibration) mark is a 10-mm calibrating deflection representing 1 mV. If the 1-mV signal produces a deflection of more or less than 10 mm, the amplitude of the wave must be corrected according to the formula: corrected amplitude (mm) = measured amplitude (mm) × 10 mm / standardization mark (mm).
Heart Rate and Rhythm AssessmentTop
1. Determine the paper speed.
2. Measure the heart rate with an ECG ruler. If you do not have a ruler:
1) If the rhythm is regular, calculate the time between 2 consecutive R waves (the RR interval) and divide 60 seconds by this value, or count the number of large boxes within each RR interval. At the 25 mm/s paper speed: 1 box = 300/min; 2 boxes = 150/min; 3 boxes = 100/min; 4 boxes = 75/min; 5 boxes = 60/min; 6 boxes = 50/min.
2) If the rhythm is irregular, count how many QRS complexes occur within 6 seconds (at the standard 25 mm/s paper speed, 6 s = 15 cm) and multiply this number by 10.
3. Assess the regularity of the rhythm.
4. Assess the origin of the rhythm:
1) Does the patient have a basic normal sinus rhythm? If not, what is the rhythm?
2) Are any of the QRS complexes not preceded by a P wave with sinus morphology (upright P waves in leads I and II)? If yes, what is their origin (supraventricular or ventricular) and are they premature?
5. Determine atrioventricular (AV) conduction. Measure the PR interval and check for P waves not followed by a QRS complex. Assess if the P waves are of sinus or nonsinus origin.
ECG AnalysisTop
1. The electrical axis of the heart can be assessed visually using the direction of QRS complexes in the limb leads (Figure 20.2-4).
1) Positive QRS in leads I and aVF: Normal axis of the heart (+90 degrees to −30 degrees).
2) QRS directed towards each other (convergent) in leads I and aVF: Right axis deviation (+90 degrees to +180 degrees).
3) Positive QRS in lead I and negative QRS in lead aVF (divergent): Left axis deviation (−30 degrees to −90 degrees).
4) Negative QRS in leads I and aVF: Indeterminate axis of the heart (±180 degrees to −90 degrees).
2. The P wave represents depolarization of the atrial myocardium:
1) Positive P waves in leads I and II indicate a normal direction of atrial depolarization and are an ECG feature of sinus rhythm.
2) Negative P waves in leads II and III indicate retrograde atrial depolarization (impulse originating in the lower part of the right or left atrium, AV junction, or ventricles).
3) Wide P waves (≥0.12 s), usually notched or biphasic, may indicate left atrial enlargement (hypertrophy or dilation) or intra-atrial conduction disturbances. A more specific feature of left atrial enlargement is biphasic positive-negative P waves in lead V1 (a negative deflection lasting ≥0.04 s with an amplitude ≥1 mm). Wide and notched P waves in the limb leads and abnormal biphasic P waves in lead V1 are called P mitrale.
4) Tall P waves (>2.5 mm in limb leads, >3 mm in precordial leads) may be seen with increased sympathetic tone or in right atrial enlargement (P pulmonale). Tall and wide P waves in limb leads with biphasic P waves and a wide negative deflection in lead V1 are seen in patients with biatrial enlargement due to congenital heart disease.
5) Invisible P waves may be hidden in T waves in the case of sinus tachycardia or may be superimposed on QRS complexes (simultaneous depolarization of the atria and the ventricles in rhythms originating in the ventricles or the AV junction). The actual absence of P waves is found in patients with inhibition of sinus node activity or with sinoatrial block.
6) Biphasic atrial waves (F waves) in the limb leads and precordial leads, usually at a rate of 250 to 350/min: Figure 3.4-2.
7) Polymorphic fine atrial waves (f waves) at a rate of 350 to 600/min, most evident in leads V1 to V2: Figure 3.4-2.
3. The PR segment corresponds to atrial repolarization:
1) Downsloping PR-segment depression: Right atrial enlargement, increased sympathetic tone.
2) Horizontal PR-segment depression: Acute pericarditis.
3) PR-segment elevation (rare): May indicate left or right atrial infarction.
4. The PR interval is the combined duration of the P wave and the PR segment. It is a measure of AV conduction time, that is, the time required for a depolarization wave to travel through the right atrium, AV node, and His-Purkinje system. The normal range is from 0.12 to 0.2 seconds.
1) Prolonged PR interval (constant or variable): see Atrioventricular Blocks.
2) Shortened PR interval: Accelerated AV conduction caused by increased sympathetic tone or, less frequently, conduction of the impulse through an accessory AV pathway.
5. The QRS complex represents depolarization of the ventricles. Determine the dominant direction of deflection (determination of the electrical axis of the heart: see above); width (normal width ranges from 0.06 to 0.11 s); and amplitude of the R, S, and Q waves:
1) A wide QRS complex (≥0.12 s) with abnormal morphology indicates abnormal depolarization of the ventricles.
a) Right bundle branch block (RBBB) or left bundle branch block (LBBB) (see Intraventricular Blocks).
b) Premature ventricular depolarization via an accessory AV pathway in preexcitation syndromes.
c) In the case of premature ventricular contractions and ventricular rhythms, QRS complexes are not preceded by P waves.
d) In the case of nonspecific intraventricular conduction delays, all components of the QRS complex are widened but do not meet the criteria for RBBB or LBBB.
2) The amplitude of R waves and S waves is useful in the diagnosis of left ventricular hypertrophy (LVH) and right ventricular hypertrophy (RVH) (Table 20.2-1). A low QRS amplitude (<5 mm in all limb leads and <10 mm in all precordial leads) is the most characteristic feature of constrictive pericarditis.
3) Abnormal Q waves: Any Q wave lasting ≥0.02 seconds or a QS complex in leads V2 and V3; Q waves lasting ≥0.03 seconds and ≥1 mm in amplitude, or QS complexes in 2 adjacent leads (I, aVL, and V6; V4-V6; II, III, aVF). QS complexes are equivalent to Q waves. They can be normally seen in lead aVR, less frequently in leads III and V1, and rarely in leads V1 and V2. In all other leads they should be considered abnormal. In asymptomatic patients with new-onset abnormal Q waves revealed by routine ECG, a diagnosis of silent myocardial infarction is made. ST-segment elevations ≥1 mm or abnormal Q waves appearing within 28 days of the first or subsequent myocardial infarction indicate reinfarction, particularly if the ECG abnormalities are associated with chest pain lasting ≥20 minutes.
Causes of abnormal Q waves and QS complexes:
a) Abnormal conduction through the contractile ventricular myocardium due to focal left myocardial necrosis (myocardial infarction), stunned myocardium, cardiomyopathy (usually septal hypertrophy from hypertrophic cardiomyopathy), preexcitation.
b) Altered conduction in the intraventricular conducting system due to LBBB (QS in leads V1 to V3) or left anterior fascicular block (LAFB) (qrS in lead V2).
c) Heart displacement: Right atrial enlargement (qR in leads V1, V1-V2, or V1-V3), emphysema (QS in leads V1-V3), left ventricular hypertrophy (QS in leads V1-V3).
6. The ST segment represents early ventricular repolarization. Under normal conditions, it is isoelectric in the limb leads and left precordial leads. In the right precordial leads, it often shows an upsloping elevation with a gentle transition into the T-wave upstroke (Figure 20.2-5, panel A).
1) ST-segment elevation (considered pathologic at the J point in leads V2-V3 if ≥1.5 mm in women, ≥2.5 mm in men <40 years, ≥2 mm in men ≥40 years, or ≥1 mm in all other leads in both sexes):
a) J-point elevation with a concave ST-segment elevation in precordial leads, less frequently in precordial and limb leads, rarely in limb leads alone: Early ventricular repolarization syndrome (normal ECG variant: Figure 20.2-5, panel B). According to the current extended definition, this syndrome includes all cases of J-point elevation, regardless of ST-segment morphology. A J-point elevation ≥1 mm that is notched (Figure 20.2-5, panel C) or has a form of a rounded terminal phase of the R wave in 2 of limb leads II, III, and aVF, and/or precordial leads V4 to V6, particularly with a coexisting horizontal or downsloping ST segment, is currently considered a potential feature of electrical instability of the ventricular myocardium predisposing to life-threatening ventricular arrhythmia and sudden cardiac death (SCD).
b) J-point elevation ≥2 mm in ≥1 lead V1 to V2 with a downsloping ST-segment elevation followed by a T-wave inversion: Brugada syndrome (after other causes have been excluded).
c) Horizontal or convex ST-segment elevation (Pardee wave) associated with depressions in reciprocal leads: Acute transmural myocardial ischemia (Figure 20.2-5, panel D) or acute myocardial infarction (Figure 20.2-5, panel E). A persistent ST-segment elevation in the leads with abnormal Q waves or with QS complexes indicates wall motion abnormalities in the area of myocardial infarction.
d) Horizontal ST-segment elevation in most leads with reciprocal depression present only in leads aVR and V1 may be suggestive of acute pericarditis (causing subepicardial injury due to inflammation). The diagnosis is confirmed by coexisting PR-segment depressions.
e) Upsloping ST-segment elevation: Increased parasympathetic tone, abnormal ventricular depolarization (bundle branch blocks, preexcitation, ventricular rhythms).
2) ST-segment depression (significant depression is ≥0.5 mm at the J point in leads V1 to V3 or ≥1 mm in all other leads, in both sexes).
a) Upsloping ST-segment depression (Figure 20.2-6, panel A) is rarely due to subendocardial left ventricular ischemia and is most frequently related to increased sympathetic tone. It is not relevant for the diagnosis of myocardial ischemia.
b) Horizontal ST-segment depression (Figure 20.2-6, panel B): Myocardial ischemia, although it may be seen in other diseases or even in healthy individuals.
c) Downsloping ST-segment depression (Figure 20.2-6, panel C) may be caused by subendocardial ischemia, although more frequently it is due to abnormal ventricular depolarization (left ventricular hypertrophy, bundle branch block, preexcitation).
7. The T wave represents the final phase of repolarization of the ventricular myocardium. Normal T waves are positive in leads I, II, and V2 to V6; positive or negative in leads III, aVL, aVF, and V1; and negative in lead aVR. There is no universally accepted upper limit for a normal T-wave duration and amplitude.
1) Negative T waves in leads V2 to V3 may be a normal variant if T-wave amplitude in lead V3 is lower than in lead V2 and T-wave amplitude in lead V2 is lower than in lead V1. Deep negative T waves are generally characteristic of myocardial infarction, or less frequently of myocarditis, hypertrophic cardiomyopathy, pheochromocytoma, or stroke.
2) Tall T waves can be seen in healthy individuals with increased parasympathetic tone but may be also a sign of acute ischemia or hyperkalemia.
3) Flat T waves are a nonspecific finding reflecting myocardial damage, which may be caused by various heart diseases or extracardiac factors (electrolyte disturbances, hypothyroidism, drugs, increased sympathetic tone).
4) Biphasic (negative-positive) or negative T waves: Bundle branch block, preexcitation, premature or additional ventricular contractions, ventricular rhythm. Abnormal negative T waves persisting after the resolution of bundle branch block, preexcitation, or ventricular rhythm with the same direction as that of previously recorded abnormal QRS complexes caused by abnormal ventricular depolarization can be caused by the so-called “cardiac memory.”
5) Negative T waves >1 mm in amplitude in 2 adjacent leads with dominant R waves or R/S ratio >1 in patients with suspected myocardial infarction without LVH or bundle branch block are suggestive of acute myocardial ischemia.
8. The QT interval is the combined duration of depolarization and repolarization of the ventricular myocardium, which may vary in individual leads (it should be measured in the lead showing the longest QT; if the U wave is superimposed on the T wave, measure the QT interval: Figure 20.2-7). It depends on the heart rate and, to a lesser extent, on sex, age, and autonomic tone.
QT intervals corrected for heart rate (QTc) are calculated using the Bazett formula:
| QTc = | measured QT (s) |
| √RR interval (s) |
If the QRS complex is wide (≥0.12 s), the JT interval, measured from the end of the QRS complex to the end of the T wave, is a more reliable measure of the duration of ventricular repolarization than the QT interval. In such cases a prolonged JT interval (JTc >0.36 s according to the Bazett formula) is a more valuable poor prognosis marker than a prolonged QT interval:
1) Shortened QT interval: Hyperkalemia, hypercalcemia, hypothermia, congenital short QT syndrome (SQTS) (QTc ≤0.34 s, or <0.36 s and ≥1 of the following: pathogenic gene mutation, family history of SQTS, family history of early SCD [≤40 years], history of ventricular tachycardia or ventricular fibrillation without organic heart disease).
2) Prolonged QT interval (≥0.45 s in men and ≥0.46 s in women; these upper limits refer to a standard ECG recorded in a supine position; any position shift from lying down to standing causes QTc prolongation); long QT syndrome (LQTS) (QTc ≥0.48 s; it can be diagnosed with a QTc of 0.46-0.47 s and episodes of syncope of unknown origin; causes: see Congenital Long-QT Syndrome).
9. U wave: Its origin is unknown. The U wave may not be visible on a standard ECG. If present, it has the highest amplitude in leads V1 to V3. Normally, it has the same direction as the preceding T wave and amplitude <2 mm in right precordial leads and <1 mm in limb leads and left precordial leads.
1) Tall U waves are usually superimposed on the T wave. They are seen in hypokalemia, pheochromocytoma, stroke, or congenital LQTS. U waves that are tall but separated from the T wave are characteristic of increased parasympathetic tone.
2) Negative U waves are rare. They may be caused by ischemia, acute myocardial infarction, or left ventricular hypertrophy.
A U wave superimposed on the T-wave downstroke has to be differentiated from a biphasic T wave. In the case of a U wave superimposed on the T-wave downstroke, the distance between the peaks is >150 milliseconds.
Effects of Electrolyte DisturbancesTop
1. Hyperkalemia:
1) Serum potassium levels of ~5.5 mmol/L cause an increased T-wave amplitude, decreased T-wave width, and shortening of QT intervals.
2) Serum potassium levels of 5.5 to 7.5 mmol/L cause widening of QRS complexes, flat P waves, and prolonged PR intervals.
3) Serum potassium levels >7.5 mmol/L cause asynchronous depolarization and repolarization of the ventricles, leading to asystole or ventricular fibrillation.
2. Hypokalemia:
1) Serum potassium levels <3.5 mmol/L cause a decreased T-wave amplitude, increased U-wave amplitude and width, and ST-segment depression (in patients with kidney disease immediately after dialysis these features may be seen even with normal potassium levels if they are lower than the baseline levels).
2) Severe hypokalemia causes prolongation of PR intervals, wide QRS complexes, premature ventricular contractions, and polymorphic ventricular tachycardia (torsade de pointes).
3. Hypercalcemia causes shortening of QT intervals (due to shortening or disappearance of ST segments). Short QT intervals coexisting with tall wide U waves suggest electrolyte abnormalities seen in patients with multiple myeloma (hypercalcemia and hypokalemia).
4. Hypocalcemia causes prolongation of QT intervals that is due to prolonged ST segments. The morphology of T waves is generally unchanged, but occasionally they may become flat or inverted.
Effects of Autonomic Nervous System Tone
1. Increased sympathetic tone causes sinus tachycardia, shortened PR and QT intervals, increased P-wave amplitude, flat T waves (which occasionally may be inverted), and upsloping ST-segment depression.
2. Increased parasympathetic tone causes sinus bradycardia, prolonged PR intervals, AV block, increased T-wave amplitudes, and upsloping ST-segment elevation, usually in the right precordial leads. Features of increased parasympathetic tone are typically seen on ECG recorded during sleep; in awaken patients, they are usually seen in young persons, most frequently in male athletes.
TABLES AND FIGURESTop
|
Feature |
Left ventricular hypertrophy |
Right ventricular hypertrophy |
|
R-wave and S-wave amplitudes |
Increased R-wave or S-wave amplitude: – R wave >26 mm in V5 or V6 – R wave >11 mm in aVL – S wave in V1 + R wave in V5(6) >35 mm – S wave in V3 + R wave in aVL >28 mm in men, >20 mm in women |
Increased R-wave amplitude in V1 and aVR: – R wave ≥7 mm in V1 – R wave ≥5 mm in aVR – R wave >S wave in V1 |
|
ST segments |
Downsloping depression |
Downsloping depression |
|
T waves |
Negative or biphasic in V5-V6 |
Negative or biphasic in V1-V2 |
|
Electrical axis of the heart |
Normal (less often left axis deviation) |
Right axis deviation >110 degrees |
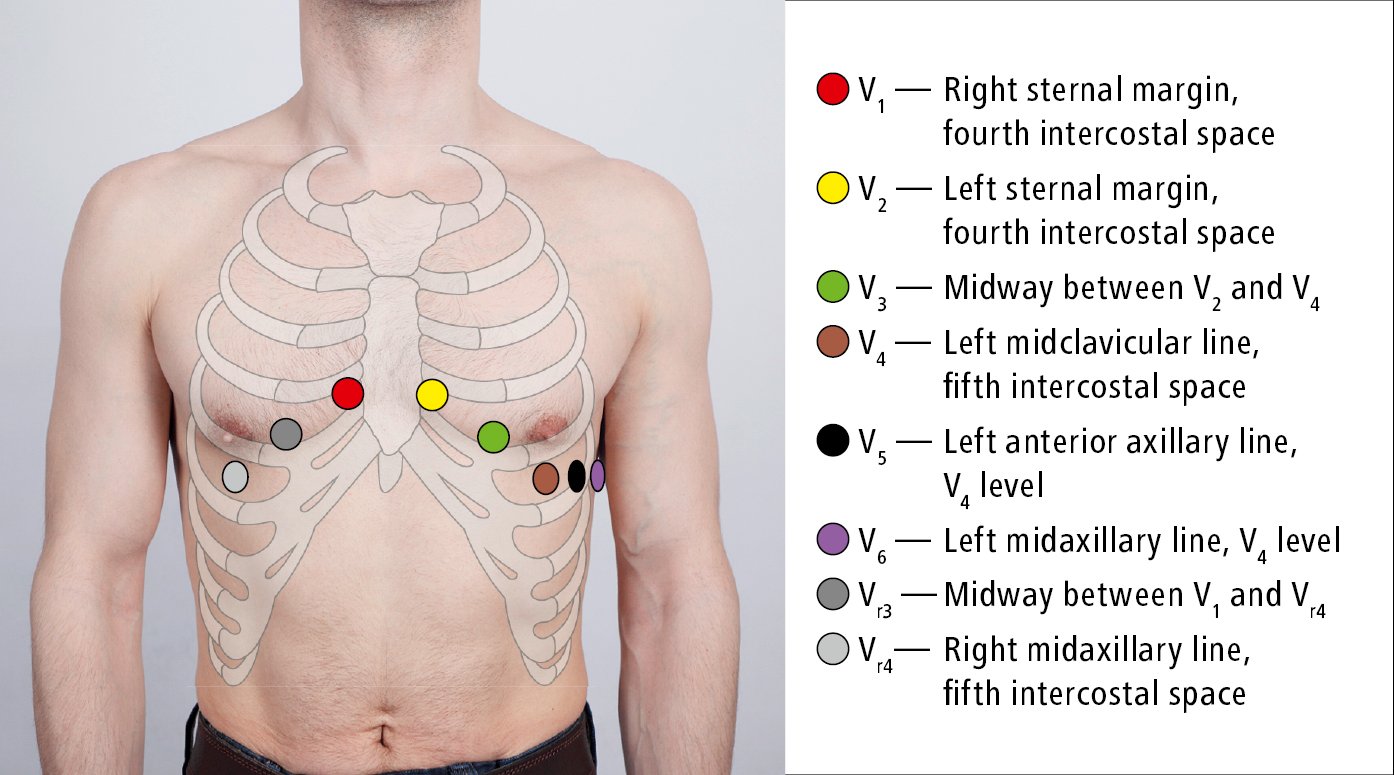
Figure 20.2-1. Placement of electrocardiographic (ECG) leads (recording electrodes).
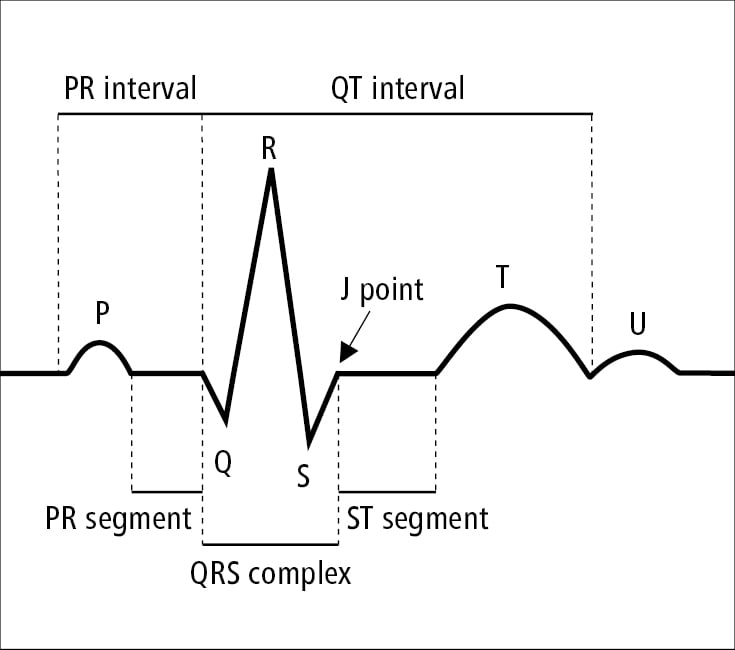
Figure 20.2-2. Waves, segments, and intervals in electrocardiography (ECG).
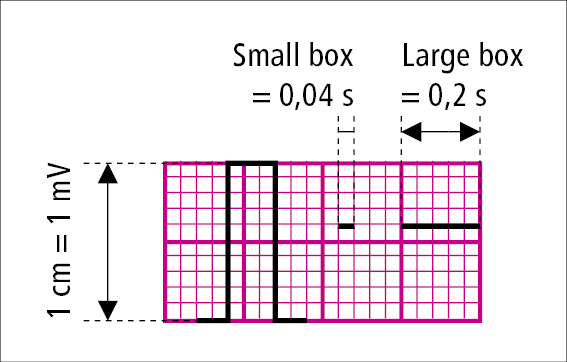
Figure 20.2-3. A millimeter grid used to measure the width and amplitude of electrocardiographic (ECG) waveforms. The standard paper speed is 25 mm/s.
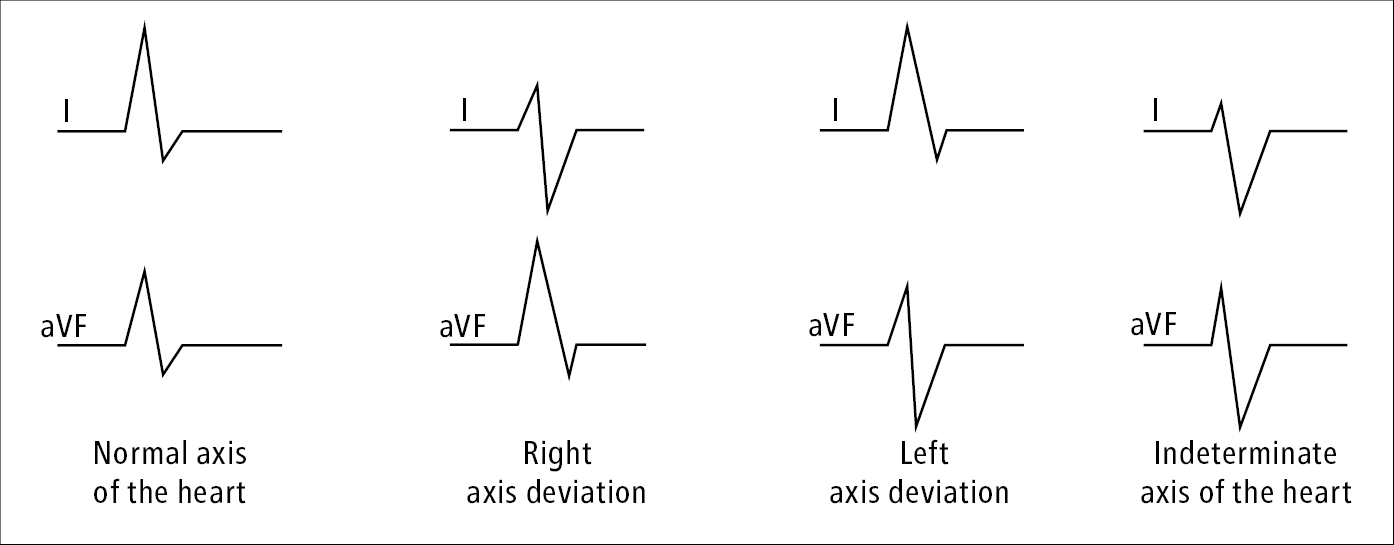
Figure 20.2-4. Determination of the electrical axis of the heart.
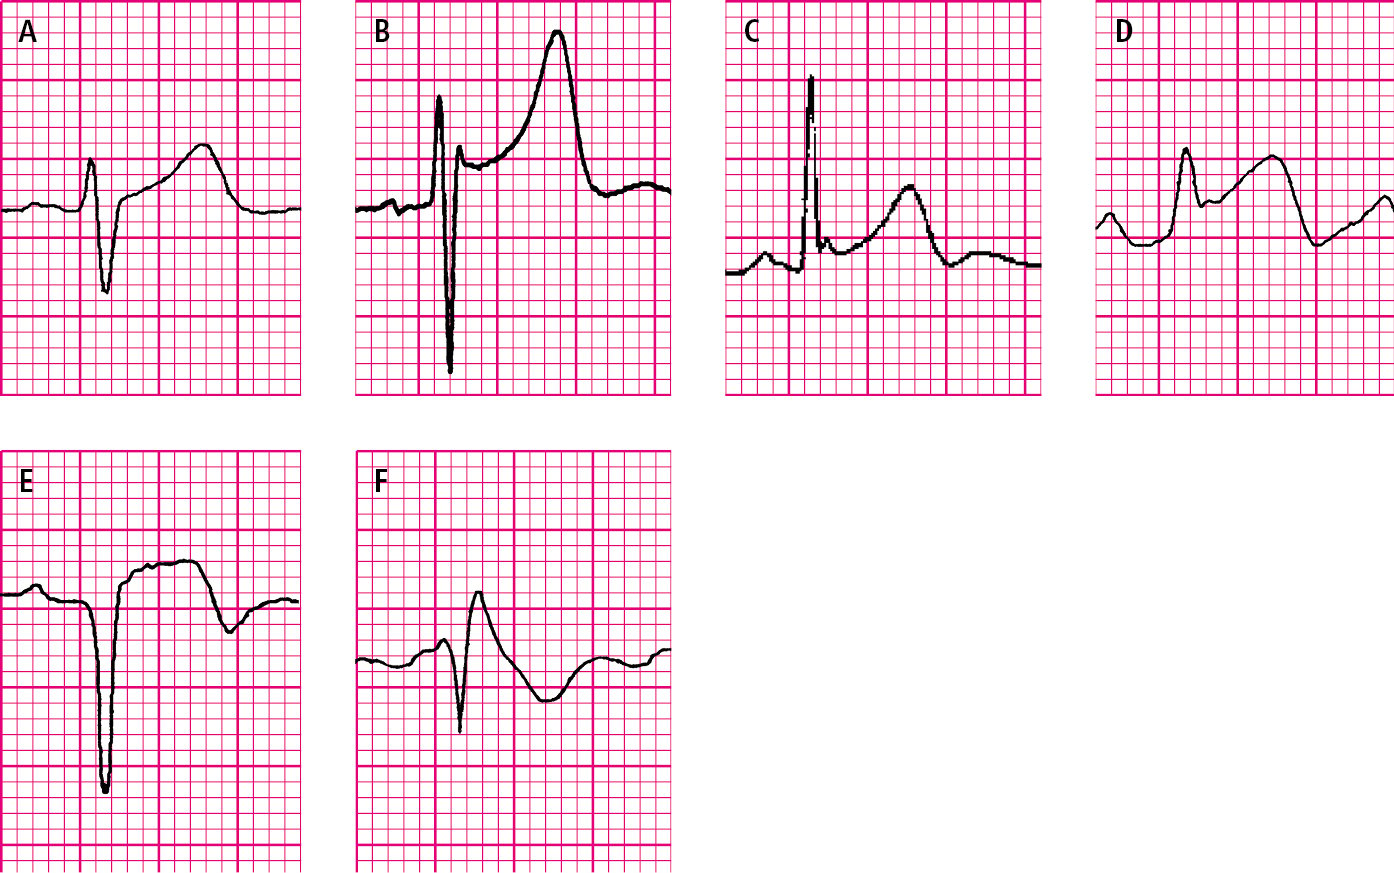
Figure 20.2-5. ST-segment elevation. A, physiologic upsloping ST-segment elevation. B, J-point elevation with concave ST-segment elevation in early ventricular repolarization syndrome. C, early ventricular repolarization syndrome with a notched terminal R-wave phase. D, ST-segment elevation during an episode of vasospastic (Prinzmetal) angina. E, ST-segment elevation in acute myocardial infarction (Pardee wave). F, downsloping (coved) ST-segment elevation in Brugada syndrome.
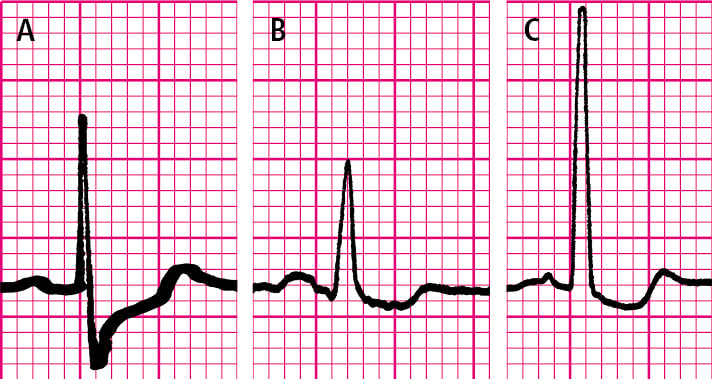
Figure 20.2-6. ST-segment depression. A, upsloping ST-segment depression. B, horizontal ST-segment depression. C, downsloping ST-segment depression.
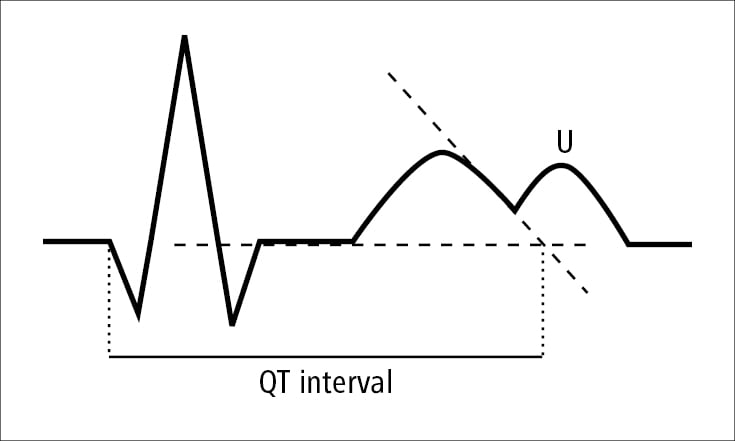
Figure 20.2-7. QT-interval measurement.